Search This Blog

Saturday, July 2, 2011

CSIRO develops GIS-based dam break modelling

CSIRO scientists have developed powerful modelling techniques to help understand the full impact of flooding that occurs when dams collapse.
 
An animation of town flooding below the Geheyan Dam.
A still from one of the animations showing flooding in a town below the Geheyan Dam. The colour of the water indicates flow speed (red is fast, blue is slow).
 
The research has been helping China’s disaster management authorities better understand the full impact of the catastrophic flooding that would occur if one of China’s, and the world’s, biggest dams collapsed.
The work could also be applied in Australia to help plan for extreme weather events.
Working with China’s Satellite Surveying & Mapping Application Centre (SASMAC), CSIRO scientists have modelled the effects of a catastrophic failure of the massive Geheyan Dam in China’s Hubei province. They have simulated the impact of flooding on the surrounding region and its infrastructure if the dam suddenly released its 3.12 billion cubic metres of water.
The Geheyan Dam holds more than five times the volume of water in Sydney Harbour. Dam failure is of particular concern in China because many of the country’s 70,000 dams are in regions prone to earthquakes.
“Seeing the possible consequences of dam failure enables us to develop appropriate emergency procedures as well as plan new infrastructure safely” Professor Xinming Tang
“We modelled six different dam failure scenarios,” said CSIRO computational scientist, Dr Mahesh Prakash. “Our simulations show where the water would go, how fast it would reach important infrastructure such as power stations and the extent of inundation in major townships downstream.”
SASMAC’s Professor Xinming Tang said the project is immensely important for disaster management planning.
“Seeing the possible consequences of dam failure enables us to develop appropriate emergency procedures as well as plan new infrastructure safely,” Professor Tang said.
CSIRO’s innovative approach combines data that changes over time – the water flow – with static landscape data from a Geographic Information System to show how infrastructure will be affected.
“The modelling technique we developed for this work is really powerful,” Dr Prakash said. “It gives us very realistic water simulations including difficult-to-model behaviours such as wave motion, fragmentation and splashing.”
The team at CSIRO used the same technique and software to model other catastrophic geophysical flow events like tsunamis, floods, storm surges as well as landslides and volcanoes. The technique was tested by modelling the 1928 St Francis dam break in California which produced a very accurate simulation of what happened in real life.
Source: http://www.csiro.au

New satellite technology helps track blue-green algae

Hiding within Australia’s picturesque coastal areas are enormous blooms of cyanobacteria. The blue-green algae have plagued the nation’s coasts for years, thanks to eutrophication, still waters, and the hot Australian sun. But new GIS surveying technology will now make tracking the blooms much more efficient.
A satellite from Bowling Green-based company Blue Water Satellite processes raw data from two Landsat USGS satellites using proprietary algorithms. The system combs every pixel of an area for signs of toxic algae activity. The technology relies on identifying the levels of total phosphorescence of every single pixel of a scanned image.

Example of a heat map produced by a Blue Water Satellite, depicting phosphorus concentrations in Western Lake Erie.

Dramatic heat-map like pictures are produced, allowing researchers to focus on areas that contain high levels of contamination. Using total phosphorescence, researchers are able to see measurements of chlorophyll-a, cyanobacteria, and phosphorous in the water and even surface soils.
Previous attempts to monitor the cyanobacteria have seen success, but the processes used were not aggressive enough, Jim Harpen, manager of business development and collaborations for Blue Water Satellite, told Storm Water Solutions.
“They’ve been testing for cyanobacteria in Australia for years, but all they’d been doing was taking a few liters of water and sending them to labs for analysis,” Harpen said. He added the spot sampling method did not do enough to determine the location and drift of a body of water over thousands of acres in size and simply expanding the number of spot sampling sites would be impractical. Harpen said he hopes the Blue Water Satellite will be the answer to this large-scale sampling problem.
Source:www.lakescientist.com

Wednesday, June 15, 2011

GLONASS more accurate than GPS: Roscosmos

Moscow, Jun 2 (Itar-Tass) Russia's navigation system GLONASS is more accurate than American GPS, Federal Space Agency (Roscosmos) Deputy Director Anatoly Shilov has cliamed."Today the accuracy of GLONASS is 6 metres, and that of GPS is 7 metres," Shilov said at the 5th international forum on satellite navigation yesterday, June 1.He said the accuracy of the Russian navigation system would have to be improved to 2-3 metres in the years to come.In his opinion, this can be done only if the system operates at full capacity with 24 satellites.Russia plans to launch another GLONASS-M satellite in August and another three in September-October from Baikonur in Kazakhstan.GLONASS system will become fully operational by the end of 2011.The previous satellite, launched in late February 26, is designed to operate longer - ten years - and provide more accurate coordinates of down to 1.5 metres.The next launch from Baikonur is scheduled for this summer. "At any rate, the system will become fully operational by the end of 2011, with 24 satellites covering the whole planet," First Deputy Prime Minister Sergei Ivanov said earlier. (Itar-Tass)

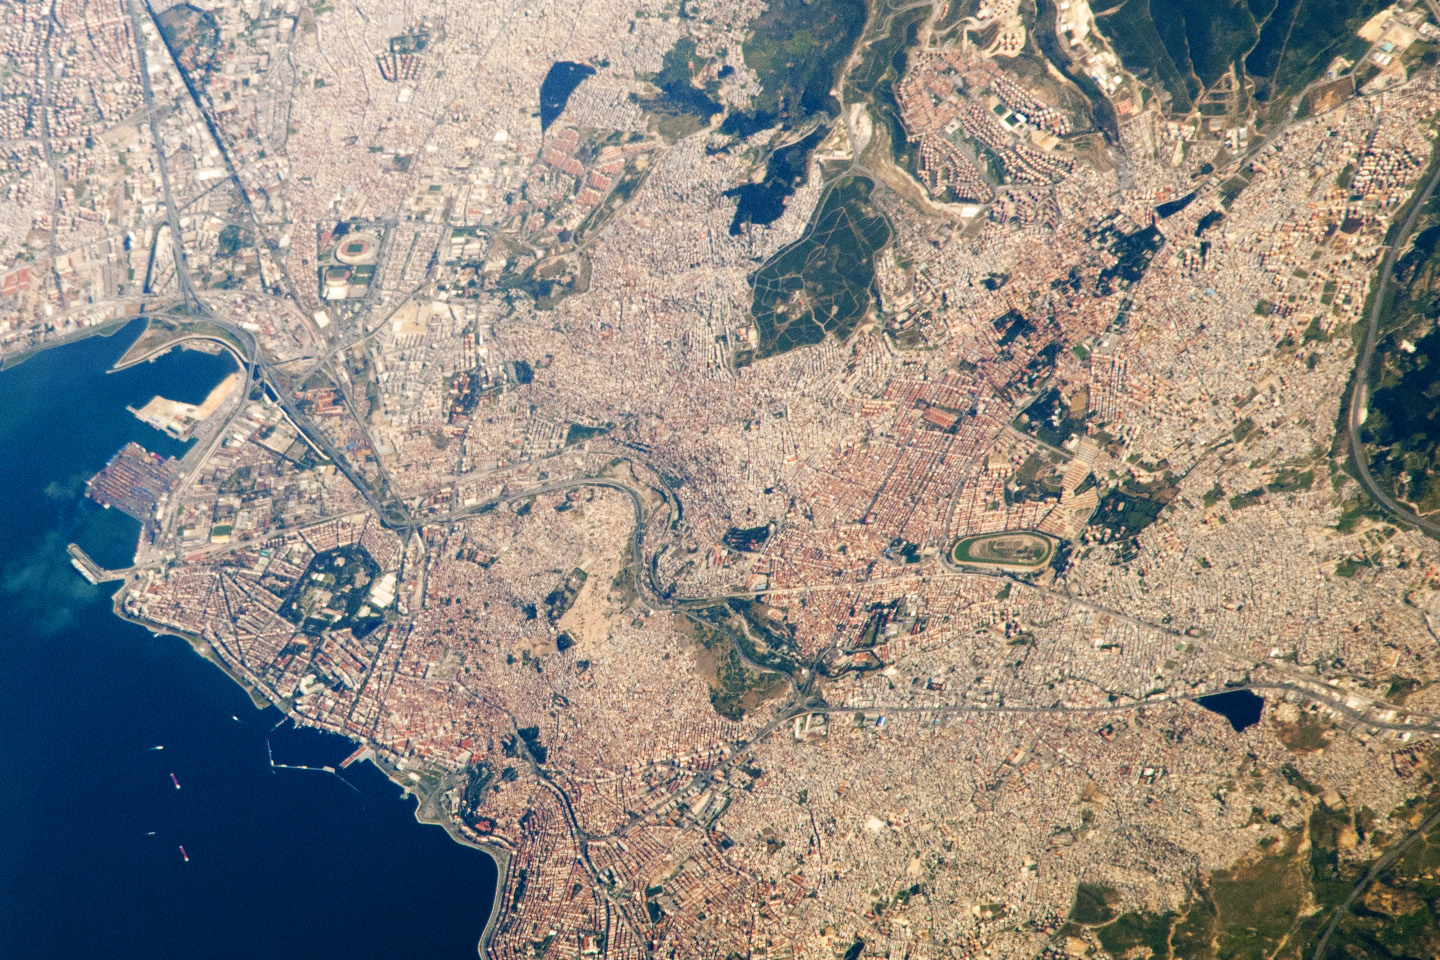
İzmir, Turkey

İzmir, Turkey
acquired May 16, 2011 download large image (837 KB, JPEG)
Located in the western Anatolia region of Turkey, İzmir is the country’s third most populous city and its second largest port (after Istanbul). This astronaut photograph highlights the modern urban landscape of the İzmir metropolitan area. In addition to being a major trade center, greater İzmir is a hub for regional tourism.
The İzmir region has included urban areas for almost 3,500 years, and the ancient core of the city was originally known as Smyrna. Due to its location on the Gulf of İzmir (lower left) and its access to the Aegean Sea, İzmir has been an important Mediterranean Sea port for most of its history.
Today, the metropolitan area includes eleven districts, many of which were independent neighborhoods prior to agglomeration into “greater İzmir.” Densely built residential and commercial districts, characterized by gray to reddish gray rooftops, occupy much of the center of the image. Larger structures with bright white rooftops are indicative of commercial/industrial areas near the port (image left).
Two large sport complexes, the Atatürk Stadium and Şirinyer Hippodrome (horse racing track) are visible at image upper left and image right. Numerous vegetated parks (green) are located throughout the area.
Source: NASA Earth Observatory

Wednesday, May 25, 2011

Egyptian pyramids found by infra-red satellite images

Saqqara pyramid  
Two new finds are at Saqqara, an older but lesser known pyramid site than Giza
Seventeen lost pyramids are among the buildings identified in a new satellite survey of Egypt.
More than 1,000 tombs and 3,000 ancient settlements were also revealed by looking at infra-red images which show up underground buildings.
Initial excavations have already confirmed some of the findings, including two suspected pyramids.
The work has been pioneered at the University of Alabama in Birmingham by US Egyptologist Dr Sarah Parcak.
satellite image of pyramid  
An infra-red satellite image shows a buried pyramid, located in the centre of the highlight box.
She says she was amazed at how much she and her team has found.
"We were very intensely doing this research for over a year. I could see the data as it was emerging, but for me the "Aha!" moment was when I could step back and look at everything that we'd found and I couldn't believe we could locate so many sites all over Egypt.
"To excavate a pyramid is the dream of every archaeologist," she said.
The team analysed images from satellites orbiting 700km above the earth, equipped with cameras so powerful they can pin-point objects less than 1m in diameter on the earth's surface.
Infra-red imaging was used to highlight different materials under the surface.
Test excavations Ancient Egyptians built their houses and structures out of mud brick, which is much denser than the soil that surrounds it, so the shapes of houses, temples and tombs can be seen.
"It just shows us how easy it is to underestimate both the size and scale of past human settlements," says Dr Parcak.
And she believes there are more antiquities to be discovered:
"These are just the sites [close to] the surface. There are many thousands of additional sites that the Nile has covered over with silt. This is just the beginning of this kind of work."
BBC cameras followed Dr Parcak on her "nervous" journey when she travelled to Egypt to see if excavations could back up what her technology could see under the surface.
In the BBC documentary Egypt's Lost Cities, they visit an area of Saqqara (Sakkara) where the authorities were not initially interested in her findings.
But after being told by Dr Parcak that she had seen two potential pyramids, they made test excavations, and they now believe it is one of the most important archaeological sites in Egypt.
An infra-red satellite image reveals the city of Tanis
But Dr Parcak said the most exciting moment was visiting the excavations at Tanis.
"They'd excavated a 3,000-year-old house that the satellite imagery had shown and the outline of the structure matched the satellite imagery almost perfectly. That was real validation of the technology."
The Egyptian authorities plan to use the technology to help - among other things - protect the country's antiquities in the future.
During the recent revolution, looters accessed some well-known archaeological sites.

Dr Sarah Parcak
Dr Sarah Parcak Space Archaeologist
"We can tell from the imagery a tomb was looted from a particular period of time and we can alert Interpol to watch out for antiquities from that time that may be offered for sale."
She also hopes the new technology will help engage young people in science and will be a major help for archaeologists around the world.
"It allows us to be more focused and selective in the work we do. Faced with a massive site, you don't know where to start.
"It's an important tool to focus where we're excavating. It gives us a much bigger perspective on archaeological sites. We have to think bigger and that's what the satellites allow us to do."
"Indiana Jones is old school, we've moved on from Indy, sorry Harrison Ford."
Source: bbc.co.uk

Tuesday, May 24, 2011

Sat nav-style technology used to track UK seabirds

Tiny trackers are being fitted to the backs of seabirds in the UK as part of a Europe-wide effort to better understand their behaviour.
Scientists are tagging birds on the Fair Isle, Orkney and Colonsay in the Hebrides.
The project called Future of the Atlantic Marine Environment (Fame) also includes species on Bardsey Island in Wales and the Isles of Scilly.
Dr Ellie Owen and seabird. Pic: Andy Hay/RSPB Dr Ellie Owen has been fitting trackers to birds on Colonsay

The RSPB said Fame used technology similar to car sat nav systems.
Trackers are also being fitted to birds in Ireland, France, Spain and Portugal.
Dr Ellie Owen, a scientist working on a European Union-funded project, said very little was known about the movements of birds as they hunted at sea.
She said: "We know more about the journeys of albatrosses in the Southern Ocean than we do about some of the seabirds around our own shores.
"For example, we know how many kittiwakes there are in the UK, and we know they've declined by 30% between 2000 and 2010.
"But we don't know where these ocean travellers are going to fish for their chicks' suppers. But now, just when these birds need our help, we're on the cusp of filling this information void with vitally-important data."
'Dwindling food' The tracking devices take a reading every 100 seconds, allowing the scientists to accurately pinpoint birds' movements between nesting colonies and the areas of sea the birds use to find food.
The RSPB said the technology was accurate to within a few metres.
In the UK, the Fame project has been tagging fulmar, shag, kittiwake, guillemot and razorbill.
Elsewhere, scientists are involved with other seabirds such as gannet, European storm petrel, Madeiran storm petrel and Balearic and Cory's shearwaters.
Dr Owen, who has fitted trackers to birds on Colonsay, said: "European seabirds face a variety of threats from dwindling food supplies, climate change, entanglement with fishing gear and pollution.
"By recording these birds' movements we are building a greater understanding of their requirements so we can begin to give these species the protection they need."
Source:bbc.co.uk

Monday, May 23, 2011

New human fossils found by satellite imagery‎

South Africa: An anthropology professor from South Africa has used Google Earth (satellite imagery) to find a new human ancestor. He found two partial skeletons, dating between 1.78 and 1.95 million years ago, that belong to the species now known as Australopithecus sediba.


"Professor Lee Berger from Witswatersrand University in Johannesburg started to use Google Earth to map various known caves and fossil deposits identified by him and his colleagues over the past several decades," according to the Official Google Blog.

Berger developed a correlation between the appearance of caves in satellite images and the presence of fossil deposits. He developed a correlation between the appearance of caves in satellite images and the presence of fossil deposits. He started with 130 cave sites in the region around the Cradle of Humankind area northwest of Johannesburg and about 20 fossil deposits. Using Google Earth's high-resolution satellite imagery, he was able to identify 500 previously unidentified caves and fossil sites. It was at one of those sites he found the new hominid.


At the beginning of this project, there were approximately 130 known cave sites in the region and around 20 fossil deposits. With the help of the navigation facility and high-resolution satellite imagery in Google Earth, Professor Berger went on to find almost 500 previously unidentified caves and fossil sites, even though the area is one of the most explored in Africa. One of these fossil sites yielded the remarkable discovery of a new species, Australopithecus sediba. This species was an upright walker that shared many physical traits with the earliest known species of the genus homo — and its introduction into the fossil record might answer some key questions about our earliest ancestry in Africa.

The discovery is one of the most significant palaeoanthropological discoveries in recent times, revealing at least two partial hominid skeletons in remarkable condition, dating to between 1.78 and 1.95 million years. We are especially excited because Google Earth played a role in its discovery.
Source: Official Google Blog